Python figure參數(shù)及subplot子圖繪制代碼
1. Python的figure參數(shù)主要有:
def figure(num=None, # autoincrement if None, else integer from 1-N figsize=None, # defaults to rc figure.figsize dpi=None, # defaults to rc figure.dpi facecolor=None, # defaults to rc figure.facecolor edgecolor=None, # defaults to rc figure.edgecolor frameon=True, FigureClass=Figure, clear=False, **kwargs ):
可以設(shè)置圖片大小、分辨率、顏色等。
2. subplot子圖繪制,子圖的繪圖參數(shù)可以分別設(shè)置
plt.figure(1)x1 = np.linspace(-0.2, 2, 10)y1 = x1**2 + 0.3plt.subplot(121)plt.scatter(x1, y1)plt.xlabel(’X’)plt.ylabel(’Y’)plt.title(’test_1’)x2 = np.linspace(-0.2, 2, 10)y2 = x2 + 0.3plt.subplot(122)plt.plot(x2, y2, color='red', linewidth=1.0, marker = ’s’, linestyle='--')## plt.plot(x, y, color='#ef5492', linewidth=2.0, marker = ’s’, linestyle='--')# plt.plot(x2, y2, ’rs--’) plt.xlabel(’X’)plt.ylabel(’Y’)plt.title(’test_2’)plt.show()
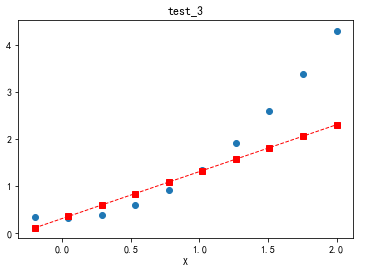
3. 在同一張圖片上顯示多種圖形,簡單說把 plt.show()放在最后即可
import matplotlib.pyplot as pltimport numpy as npplt.figure(2)x1 = np.linspace(-0.2, 2, 10)y1 = x1**2 + 0.3plt.scatter(x1, y1)x2 = np.linspace(-0.2, 2, 10)y2 = x2 + 0.3plt.plot(x2, y2, color='red', linewidth=1.0, marker = ’s’, linestyle='--')## plt.plot(x, y, color='#ef5492', linewidth=2.0, marker = ’s’, linestyle='--')# plt.plot(x2, y2, ’rs--’) plt.xlabel(’X’)plt.ylabel(’Y’)plt.title(’test_3’)plt.show()
以上就是本文的全部內(nèi)容,希望對大家的學(xué)習(xí)有所幫助,也希望大家多多支持好吧啦網(wǎng)。
相關(guān)文章:
1. Java進(jìn)行Appium自動化測試的實(shí)現(xiàn)2. 詳細(xì)總結(jié)Java for循環(huán)的那些坑3. php中PHPUnit框架實(shí)例用法4. Python通過format函數(shù)格式化顯示值5. 新手學(xué)python應(yīng)該下哪個(gè)版本6. jsp文件下載功能實(shí)現(xiàn)代碼7. uni-app結(jié)合PHP實(shí)現(xiàn)單用戶登陸demo及解析8. 如何利用Python matplotlib繪制雷達(dá)圖9. ajax實(shí)現(xiàn)頁面的局部加載10. 詳解CSS偽元素的妙用單標(biāo)簽之美

 網(wǎng)公網(wǎng)安備