用Python繪制漫步圖實例講解
我們首先來看下代碼:
import matplotlib.pyplot as pltfrom random import choiceclass RandomWalk(): def __init__(self,num_points=5000): self.num_points=num_points self.x_values=[0] self.y_values=[0] def fill_walk(self): while len(self.x_values)<self.num_points: x_direction=choice([1,-1]) x_distance=choice([0,1,2,3,4]) x_step=x_direction*x_distance y_direction=choice([1,-1]) y_distance=choice([0,1,2,3,4]) y_step=y_direction*y_distance if x_step==0 and y_step==0: continue next_x=self.x_values[-1]+x_step next_y=self.y_values[-1]+y_step self.x_values.append(next_x) self.y_values.append(next_y)rw=RandomWalk()rw.fill_walk()plt.scatter(rw.x_values,rw.y_values,s=1)plt.show()
繪制出的圖如下所示:
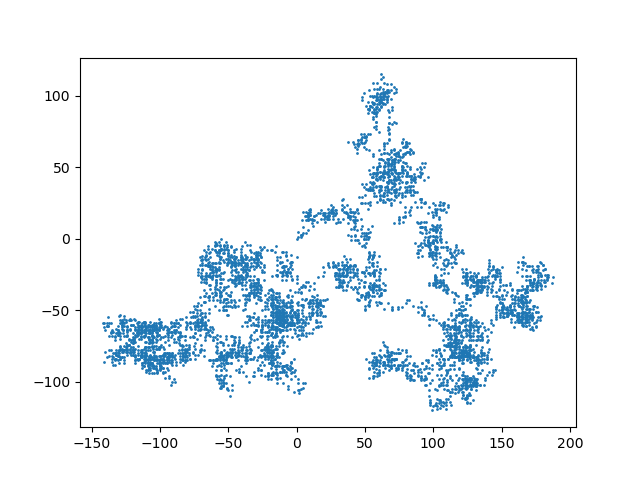
這段代碼繪制了5000個數據點,這些點的分布完全是隨機的。每次運行代碼都會有不同的走向。
實例擴展:
from random import choice class RandomWalk(): '''一個生成隨機漫步數據的類''' def __init__(self,num_points=5000): '''初始化隨機漫步的屬性''' self.num_points = num_points #所有隨機漫步都始于(0,0) self.x_values = [0] self.y_values = [0] def fill_walk(self): '''計算隨機漫步包含的所有點''' #不斷漫步,直到列表達到指定的長度 while len(self.x_values) < self.num_points: # 決定前進方向以及沿這個方向前進的距離 x_direction = choice([1,-1]) x_distance = choice([0,1,2,3,4]) x_step = x_direction * x_distance y_direction = choice([1,-1]) y_distance = choice([0,1,2,3,4]) y_step = y_direction * x_distance # 拒絕原地踏步 if x_step == 0 and y_step == 0: continue #計算下一個點的x和y值 next_x = self.x_values[-1] + x_step next_y = self.y_values[-1] + y_step self.x_values.append(next_x) self.y_values.append(next_y)
import matplotlib.pyplot as plt from random_walk import RandomWalk # 創建一個RandomWalk實例,并將其包含的點都繪制出來rw = RandomWalk(50000)rw.fill_walk() # 設置繪圖窗口的尺寸plt.figure(dpi=80,figsize=(10,6)) # 設置點按先后順序增加顏色深度point_numbers = list(range(rw.num_points))plt.scatter(rw.x_values,rw.y_values,c=point_numbers,cmap=plt.cm.Blues, edgecolor=’none’,s=1) # 突出起點和終點,起點設置為綠色,終點設置為紅色plt.scatter(0,0,c=’green’,edgecolor=’none’,s=100)plt.scatter(rw.x_values[-1],rw.y_values[-1],c=’red’,edgecolor=’none’,s=100) # 隱藏坐標軸plt.axes().get_xaxis().set_visible(False)plt.axes().get_yaxis().set_visible(False) plt.show()
第二個實例內容差不多,是用的PY3.5,大家可以本地測試下。
到此這篇關于用Python繪制漫步圖實例講解的文章就介紹到這了,更多相關使用Python繪制漫步圖內容請搜索好吧啦網以前的文章或繼續瀏覽下面的相關文章希望大家以后多多支持好吧啦網!
相關文章:
 網公網安備
網公網安備