python seaborn heatmap可視化相關(guān)性矩陣實(shí)例
方法
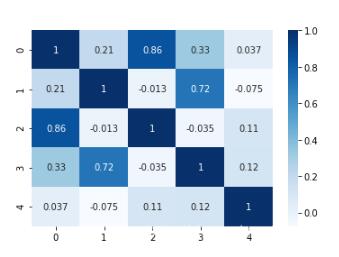
import pandas as pdimport numpy as npimport seaborn as snsdf = pd.DataFrame(np.random.randn(50).reshape(10,5))corr = df.corr()sns.heatmap(corr, cmap=’Blues’, annot=True)
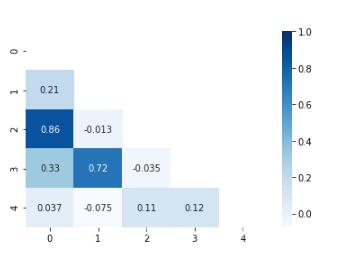
將矩陣型簡(jiǎn)化為對(duì)角矩陣型:
mask = np.zeros_like(corr)mask[np.tril_indices_from(mask)] = Truesns.heatmap(corr, cmap=’Blues’, annot=True, mask=mask.T)
補(bǔ)充知識(shí):Python【相關(guān)矩陣】和【協(xié)方差矩陣】
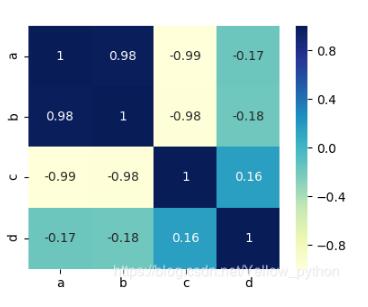
相關(guān)系數(shù)矩陣
pandas.DataFrame(數(shù)據(jù)).corr()
import pandas as pddf = pd.DataFrame({ ’a’: [11, 22, 33, 44, 55, 66, 77, 88, 99], ’b’: [10, 24, 30, 48, 50, 72, 70, 96, 90], ’c’: [91, 79, 72, 58, 53, 47, 34, 16, 10], ’d’: [99, 10, 98, 10, 17, 10, 77, 89, 10]})df_corr = df.corr()# 可視化import matplotlib.pyplot as mp, seabornseaborn.heatmap(df_corr, center=0, annot=True, cmap=’YlGnBu’)mp.show()
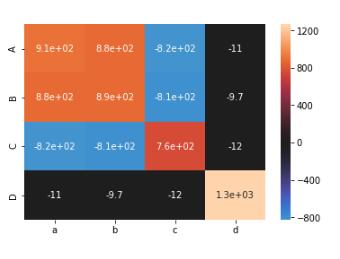
協(xié)方差矩陣
numpy.cov(數(shù)據(jù))
import numpy as npmatric = [ [11, 22, 33, 44, 55, 66, 77, 88, 99], [10, 24, 30, 48, 50, 72, 70, 96, 90], [91, 79, 72, 58, 53, 47, 34, 16, 10], [55, 20, 98, 19, 17, 10, 77, 89, 14]]covariance_matrix = np.cov(matric)# 可視化print(covariance_matrix)import matplotlib.pyplot as mp, seabornseaborn.heatmap(covariance_matrix, center=0, annot=True, xticklabels=list(’abcd’), yticklabels=list(’ABCD’))mp.show()
補(bǔ)充
協(xié)方差
相關(guān)系數(shù)
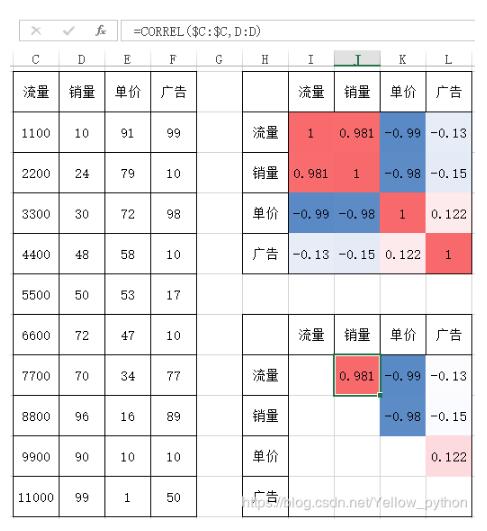
EXCEL也能做
CORREL函數(shù)
以上這篇python seaborn heatmap可視化相關(guān)性矩陣實(shí)例就是小編分享給大家的全部?jī)?nèi)容了,希望能給大家一個(gè)參考,也希望大家多多支持好吧啦網(wǎng)。
相關(guān)文章:
1. 如何對(duì)php程序中的常見(jiàn)漏洞進(jìn)行攻擊2. PHP循環(huán)與分支知識(shí)點(diǎn)梳理3. Spring MVC+ajax進(jìn)行信息驗(yàn)證的方法4. jsp EL表達(dá)式詳解5. JavaWeb Servlet中url-pattern的使用6. ASP中格式化時(shí)間短日期補(bǔ)0變兩位長(zhǎng)日期的方法7. 利用ajax+php實(shí)現(xiàn)商品價(jià)格計(jì)算8. JSP之表單提交get和post的區(qū)別詳解及實(shí)例9. .NET6打包部署到Windows Service的全過(guò)程10. ThinkPHP5 通過(guò)ajax插入圖片并實(shí)時(shí)顯示(完整代碼)

 網(wǎng)公網(wǎng)安備