python中用ggplot繪制畫圖實例講解
Python的繪圖庫也允許用戶創(chuàng)建優(yōu)雅的圖形,本章給大家介紹的是關(guān)于ggplot繪制畫圖的技巧,ggplot2建立在grid系統(tǒng)上,這個系統(tǒng)不支持紋理。需要額外創(chuàng)建一堆數(shù)據(jù),再基于這些數(shù)據(jù)構(gòu)建一個geom_path圖層,蓋在柱圖上才可以進(jìn)行各種繪制,下面給大家詳細(xì)講解下怎么使用ggplot繪圖。
簡介:ggplot類是在plotnine中的,能夠生成一個圖形。
安裝:pip install pandas plotnine
csv文件加載到survs_df的數(shù)據(jù)框架:
ggplot(survs_df, aes(x=’weight’, y=’hindfoot_length’,size = ’year’)) + geom_point()生成圖形步驟:
1、設(shè)置數(shù)據(jù)框
2、需要將數(shù)據(jù)框架轉(zhuǎn)換成位置、顏色、大小等
3、顯示實際圖形元素
實例代碼:
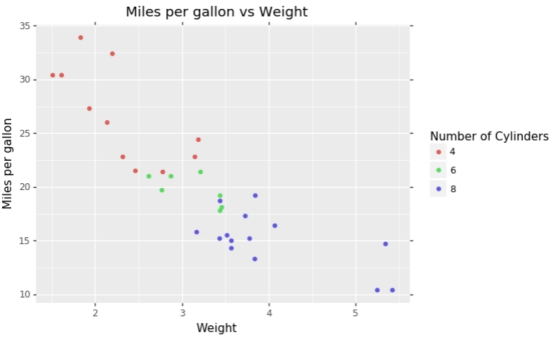
(ggplot(mtcars, aes(‘wt’, ‘mpg’, color=’factor(cyl)’))+ geom_point()+ labs(title=’Miles per gallon vs Weight’, x=’Weight’, y=’Miles per gallon’)+ guides(color=guide_legend(title=’Number of Cylinders’)) )
輸出效果:
知識點(diǎn)擴(kuò)展:
繪制散點(diǎn)圖,geom_point()
讀取外部數(shù)據(jù)進(jìn)行繪圖
>>> import pandas as pd>>> from ggplot import *>>> df=pd.read_table(’C:UserslenovoDesktopmtcars.txt’)>>> df··name type number volume size other0 td T 96 3 20 c1 sf F 87 5 65 c2 cc F 79 9 80 d
如果讀取的數(shù)據(jù)沒有column可以添加
df.columns=[’name’,’type’,’number’,’volume’,’size’,’other’]>>> p=ggplot(df, aes(x=’number’, y=’volume’, size=’factor(size)’, color=’factor(other)’))+geom_point()>>> print p
到此這篇關(guān)于python中用ggplot繪制畫圖實例講解的文章就介紹到這了,更多相關(guān)python中g(shù)gplot怎么繪制畫圖內(nèi)容請搜索好吧啦網(wǎng)以前的文章或繼續(xù)瀏覽下面的相關(guān)文章希望大家以后多多支持好吧啦網(wǎng)!
相關(guān)文章:
1. WML的簡單例子及編輯、測試方法第1/2頁2. 前端html+css實現(xiàn)動態(tài)生日快樂代碼3. XML基本概念XPath、XSLT與XQuery函數(shù)介紹4. el-input無法輸入的問題和表單驗證失敗問題解決5. 關(guān)于html嵌入xml數(shù)據(jù)島如何穿過樹形結(jié)構(gòu)關(guān)系的問題6. CSS3實例分享之多重背景的實現(xiàn)(Multiple backgrounds)7. 不要在HTML中濫用div8. vue實現(xiàn)復(fù)制文字復(fù)制圖片實例詳解9. XML入門的常見問題(三)10. XML入門的常見問題(四)
 網(wǎng)公網(wǎng)安備